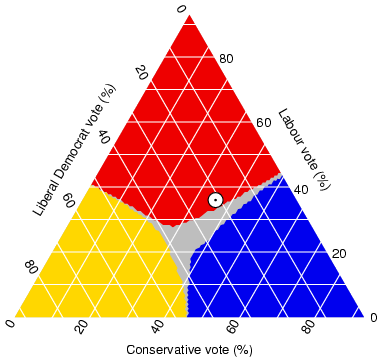
These plot graphs resemble scatter plots but with an added variable. The graph is in a triangular shape and the line of best fit is drawn for each variable. Usually when these three lines cross, that point resembles an equilibrium for the variables.
http://ex-parrot.com/~chris/wwwitter/20050407-it_doesnt_matter_how_you_vote_either_way_your_planet_is_doomed.html

No comments:
Post a Comment